Git
By Niklas Schneider (last updated: not yet)
Example Intro
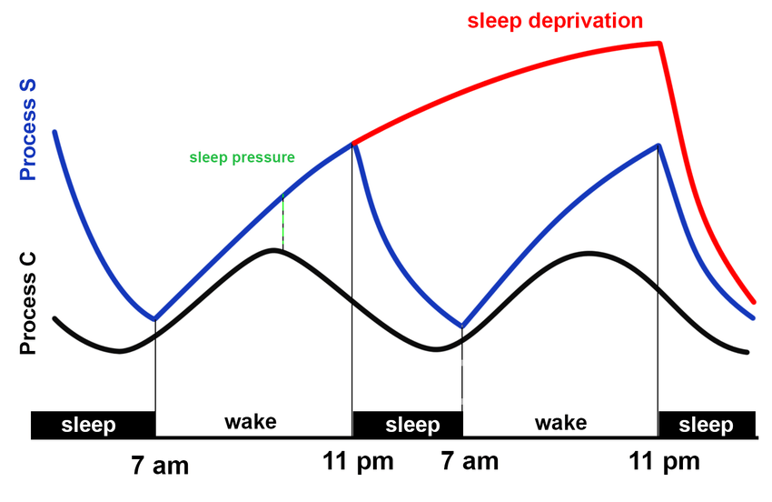
We just love the 2-process model by Alexander Borberly:

I’m not going to bother explaining it, so just look here.
If you can’t do something fancy in Markdown, you can just write in HTML: Just Google It!
But! What if someone here already presents it? Well I can just link it like so.
In case you didn’t notice, there’s a cute little menu on the left, but it will only write up to three ### pound signs.
Sub point to the intro
- Bulleted
- List
- Numbered
- List
Example Code
Var1 = 3;
Var2 = 5;

Result = Var1*Var2;
Now just replace the numbers in Var1 and you can do math!
Example data
If you’re really fancy, you can add a table:
| Row Names | Data |
|---|---|
| First row | Lots of data |
| Second row | More data |
A = 3;
B = [1 2 3];
F = plot(B,A);

close all
The m makes it matlab colored