Artifact rejection
By Sven Leach
Definition
These noise, or artifact, sources include: line noise from the power grid, eye blinks, eye movements, heart beat, breathing, and other muscle activity. Some artifacts, such as eye blinks, produce voltage changes of much higher amplitude than the endogenous brain activity.
Types of artifacts
https://www.researchgate.net/profile/Alok_Mittal/publication/228951651_ARTIFACT_REMOVAL_FROM_EEG_RECORDINGS-AN_OVERVIEW/links/00b7d52676ccdc1fa7000000/ARTIFACT-REMOVAL-FROM-EEG-RECORDINGS-AN-OVERVIEW.pdf
https://www.caeaccess.org/research/volume4/number1/tandle-2016-cae-651997.pdf
If the source is the subject’s body, that artefact is called physiological artefact. If the source is external it is called external artefact.
Physiological artifacts
Physiological Artefacts Physiological artefacts are the artefact originated because of electrical activity of other body parts of the subject and obscure the EEG signals
Eye blinks
Eye Blink artifact: It is very common in EEG data, produces a high amplitude signal that can be many times greater than EEG signals of interest. Because of its high amplitude an eye blink can corrupt data on all electrodes, even those at the back of the head. Eye artifacts are often measured more directly in the electrooculargram (EOG), pairs of electrodes placed above and around the eyes. Unfortunately, these measurements are contaminated with EEG signals of interest and so simple subtraction is not a removal option
Eye blinks produce high amplitude signals that can be many times greater than the amplitude of EEG signals of interest. Repetitive blinks produce slow wave, which appear like delta waves
Eye movements
These artifacts are caused by the reorientation of the retinocorneal dipole [3]. The effect of this artifact is stronger than that of the eye blink artifact. Eye blinks and movements often occur at close intervals.
A movement of the eyes and eyeballs causes a change of potential in the electrodes near the eyes at Fp1-Fp2 (Fronto Parietal). Fluttering of the eyelids appears as a 3Hz –10Hz signal.
ERG or Elertroretinogram is a potential difference between retina and cornea of the eye and with incident light; it changes, causing artefacts in EEG signals. Voltage amplitude is proportional to the angle of gaze. This artefact mixed with slow EEG is prominent in REM sleep
Muscle Activity
These artifacts are caused by activity in different muscle groups including neck and facial muscles. These signals have a wide frequency range and can be distributed across different sets of electrodes depending on the location of the source muscles.
Heart beat
When an electrode is placed on or near a blood vessel, it causes pulse, or heart beat, artifact. The expansion and contraction of the vessel introduce voltage changes into the recordings. The artifact signal has a frequency around 1.2Hz, but can vary with the state of the object. This artifact can appear as a sharp spike or smooth wave [4].
Breathing
Sweat
Perspiration artefact exhibited as low amplitude, swelling waves that typically have durations greater than 2 sec; thus, they are beyond the frequency range of cerebrally generated EEG
Movement
External Artefacts
The sources of these artefacts are electronic gadgets, transmission lines etc.
Line noise
Strong signals from A/C power supplies can corrupt EEG data during transfer from the scalp electrodes to the recording device. Notch filters are often used to filter this artifact containing lower frequency line noise and harmonics. Notch filtering at these frequencies can remove useful information. Line noise can corrupt the data from some or all of the electrodes depending on the source of the problem.
Electrode pops
Phone Artefact
This artefact is because of mobile phone signal. A high frequency signal appears as a spurious signal on the EEG signals. Remedy for this artefact is not to carry a mobile phone while recording this artefact shown in fig10.electrical characteristic shown in table 1.
Poor electrode contact
Poor electrode contact gives rise to low frequency artifacts, they are brief transients that are limited to one-electrode and synchronize with respiration due to the motion of the electrode.
Artifact removal
Our lab’s approach
As sleep EEG consists of hours and hours of data, cleaning sleep EEGs can usually be accomplished by simply removing the parts of the data which contain artifacts. In our lab, this is done in two steps:

- During sleep scoring, noisy segments of data are manually classified. One time window (epoch) that we use for sleep scoring is usually 20s long. Each of those 20s windows can be divided into smaller 4s windows. During sleep scoring, 4s epochs are visually classified as clean or noisy. As we perform sleep scoring in 20s epochs, any 4s epoch within a 20s epoch will result in the particular 20s epoch to be classified as noise as well. During sleep scoring, we see the data of one frontal, one central and one occipital channel. Even though manual artifact removal can be considered as one of the most thorough procedures, going through all 128 HD-EEG channels manually would require a tremendous amount of work.
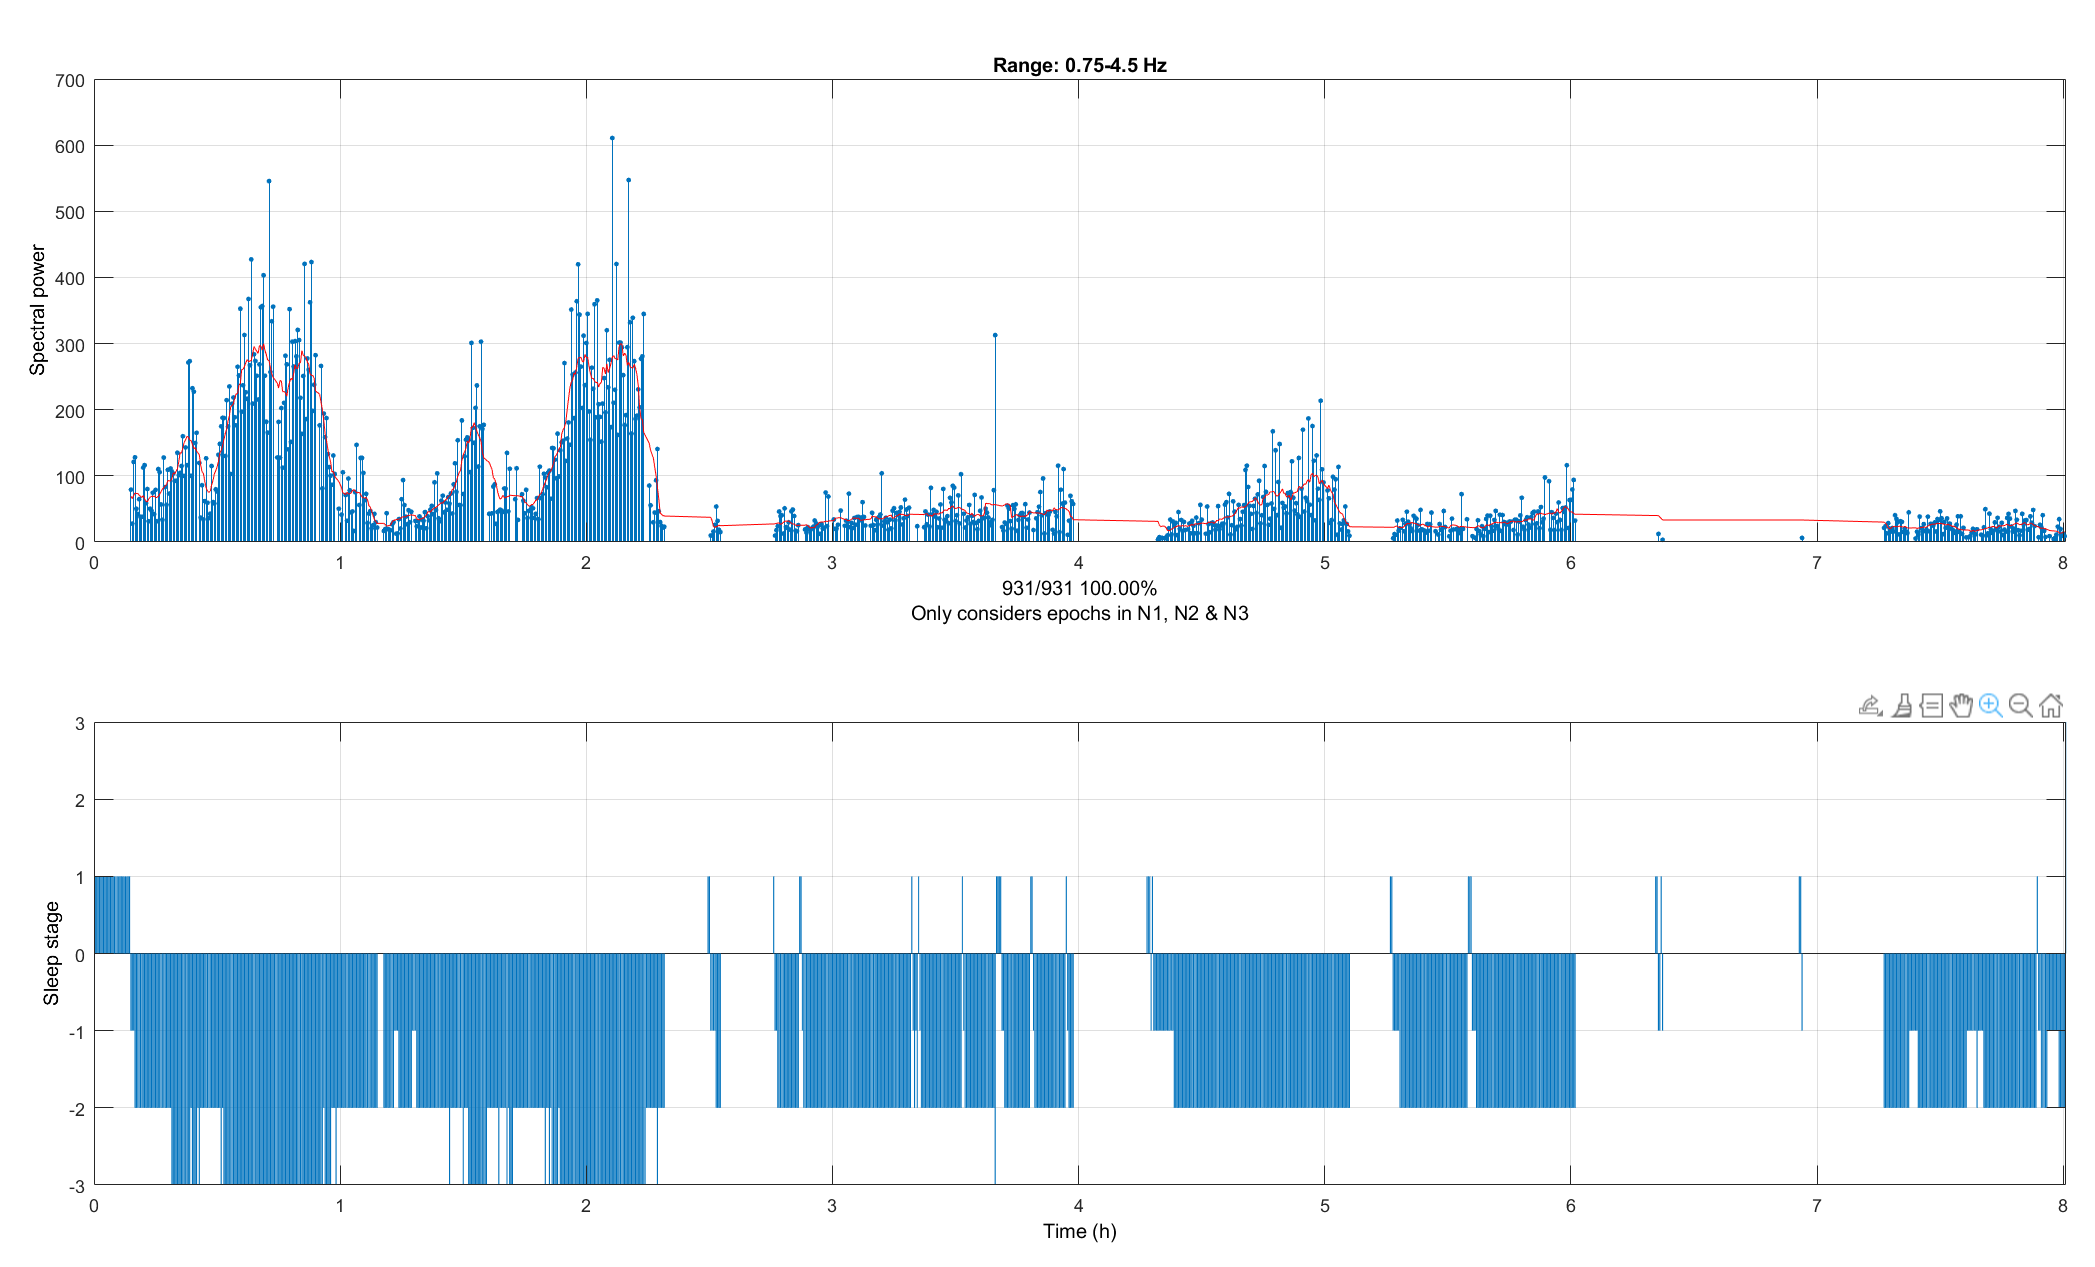
- This is why in a second step, we perform a semi-automatic artifact removal procedure on all 128 HD-EEG channels. For this, the power in the slow-wave (0.75 – 4.5 Hz, shown) and muscle (20 – 40 Hz, not shown) frequency band is computed for all remaining 20s epochs and all channels (the plot shows one channel). Remaining 20s epochs are those that were not marked as noisy during sleep scoring and additionally staged as N1, N2 or N3. The power is computed with an FFT routine (Hanning window, averages of five 4 s epochs). The power values of all epochs are visualized for each channel consecutively. Whenever the power in either the slow-wave or muscle frequency band peaks out from their neighbours, it is likely that this epoch contains an artifact and is removed.
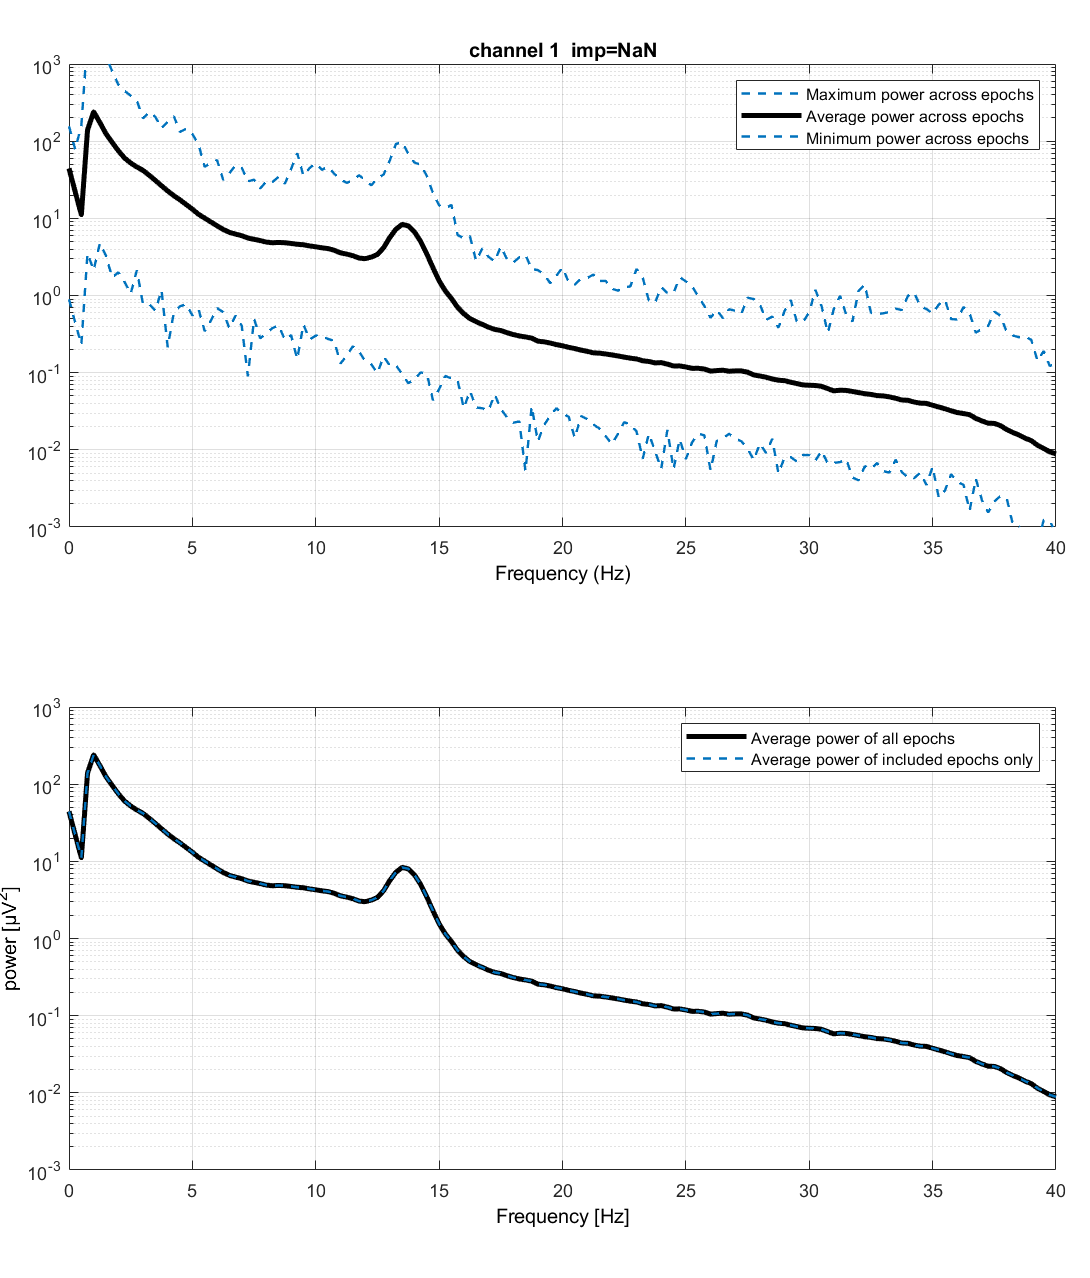
- The average power in all frequencies helps you to decide whether this channel still contains noisy epochs or not. Usually, when removing epochs with body movement artifacts, the dotted blue line should be lower in the respective frequencies that a body movement carries (e. g. delta and beta frequency).
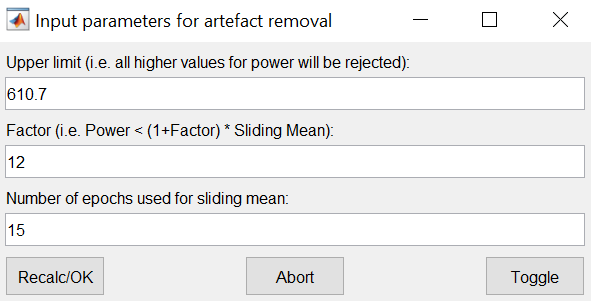
- You can control the artifact removal procedure with this GUI. The
upper limitfield simply applies a threshold. When epochs have a higher spectral power value than your upper limit, they will be removed. TheFactorfield determines how much a peak in spectral power needs to stand out in order to be considered as an outlier. The lower the value, the easier it is for any epoch to stand out from it’s neighbours and to be removed. Thesliding meanfield determines how many epochs should be considered for calculating the sliding mean (the red line in the spectral power plot). This is rarely used, but could also be used to determine how easy an epoch stands out from it’s neighbours.
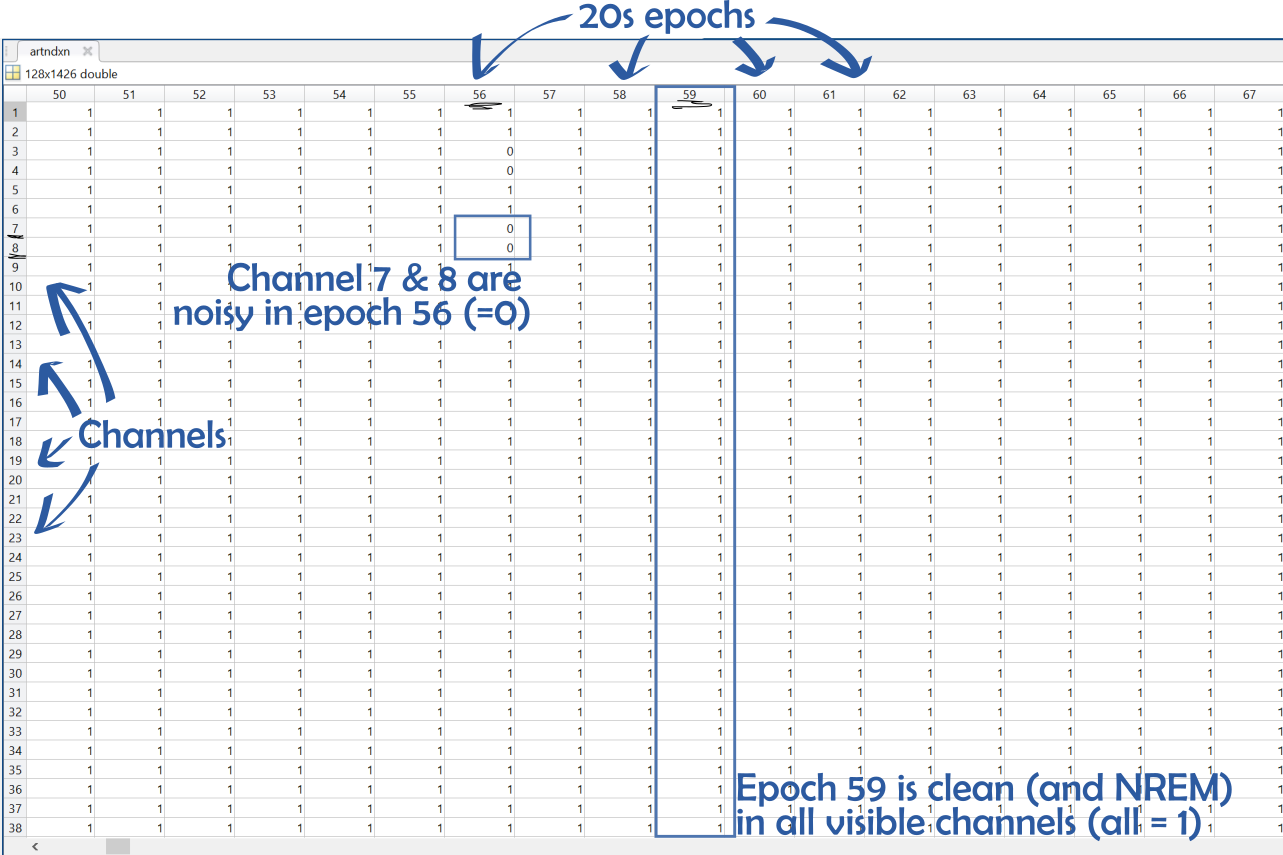
- Eventually you will build a matrix (channel x epochs) of zeros and ones. Clean epochs are labelled as ones, whereas noisy epochs are reffered to with zeros. We usually perform our analyses only on those parts of the data, in which all channels are clean, meaning in which all channels have the number one.
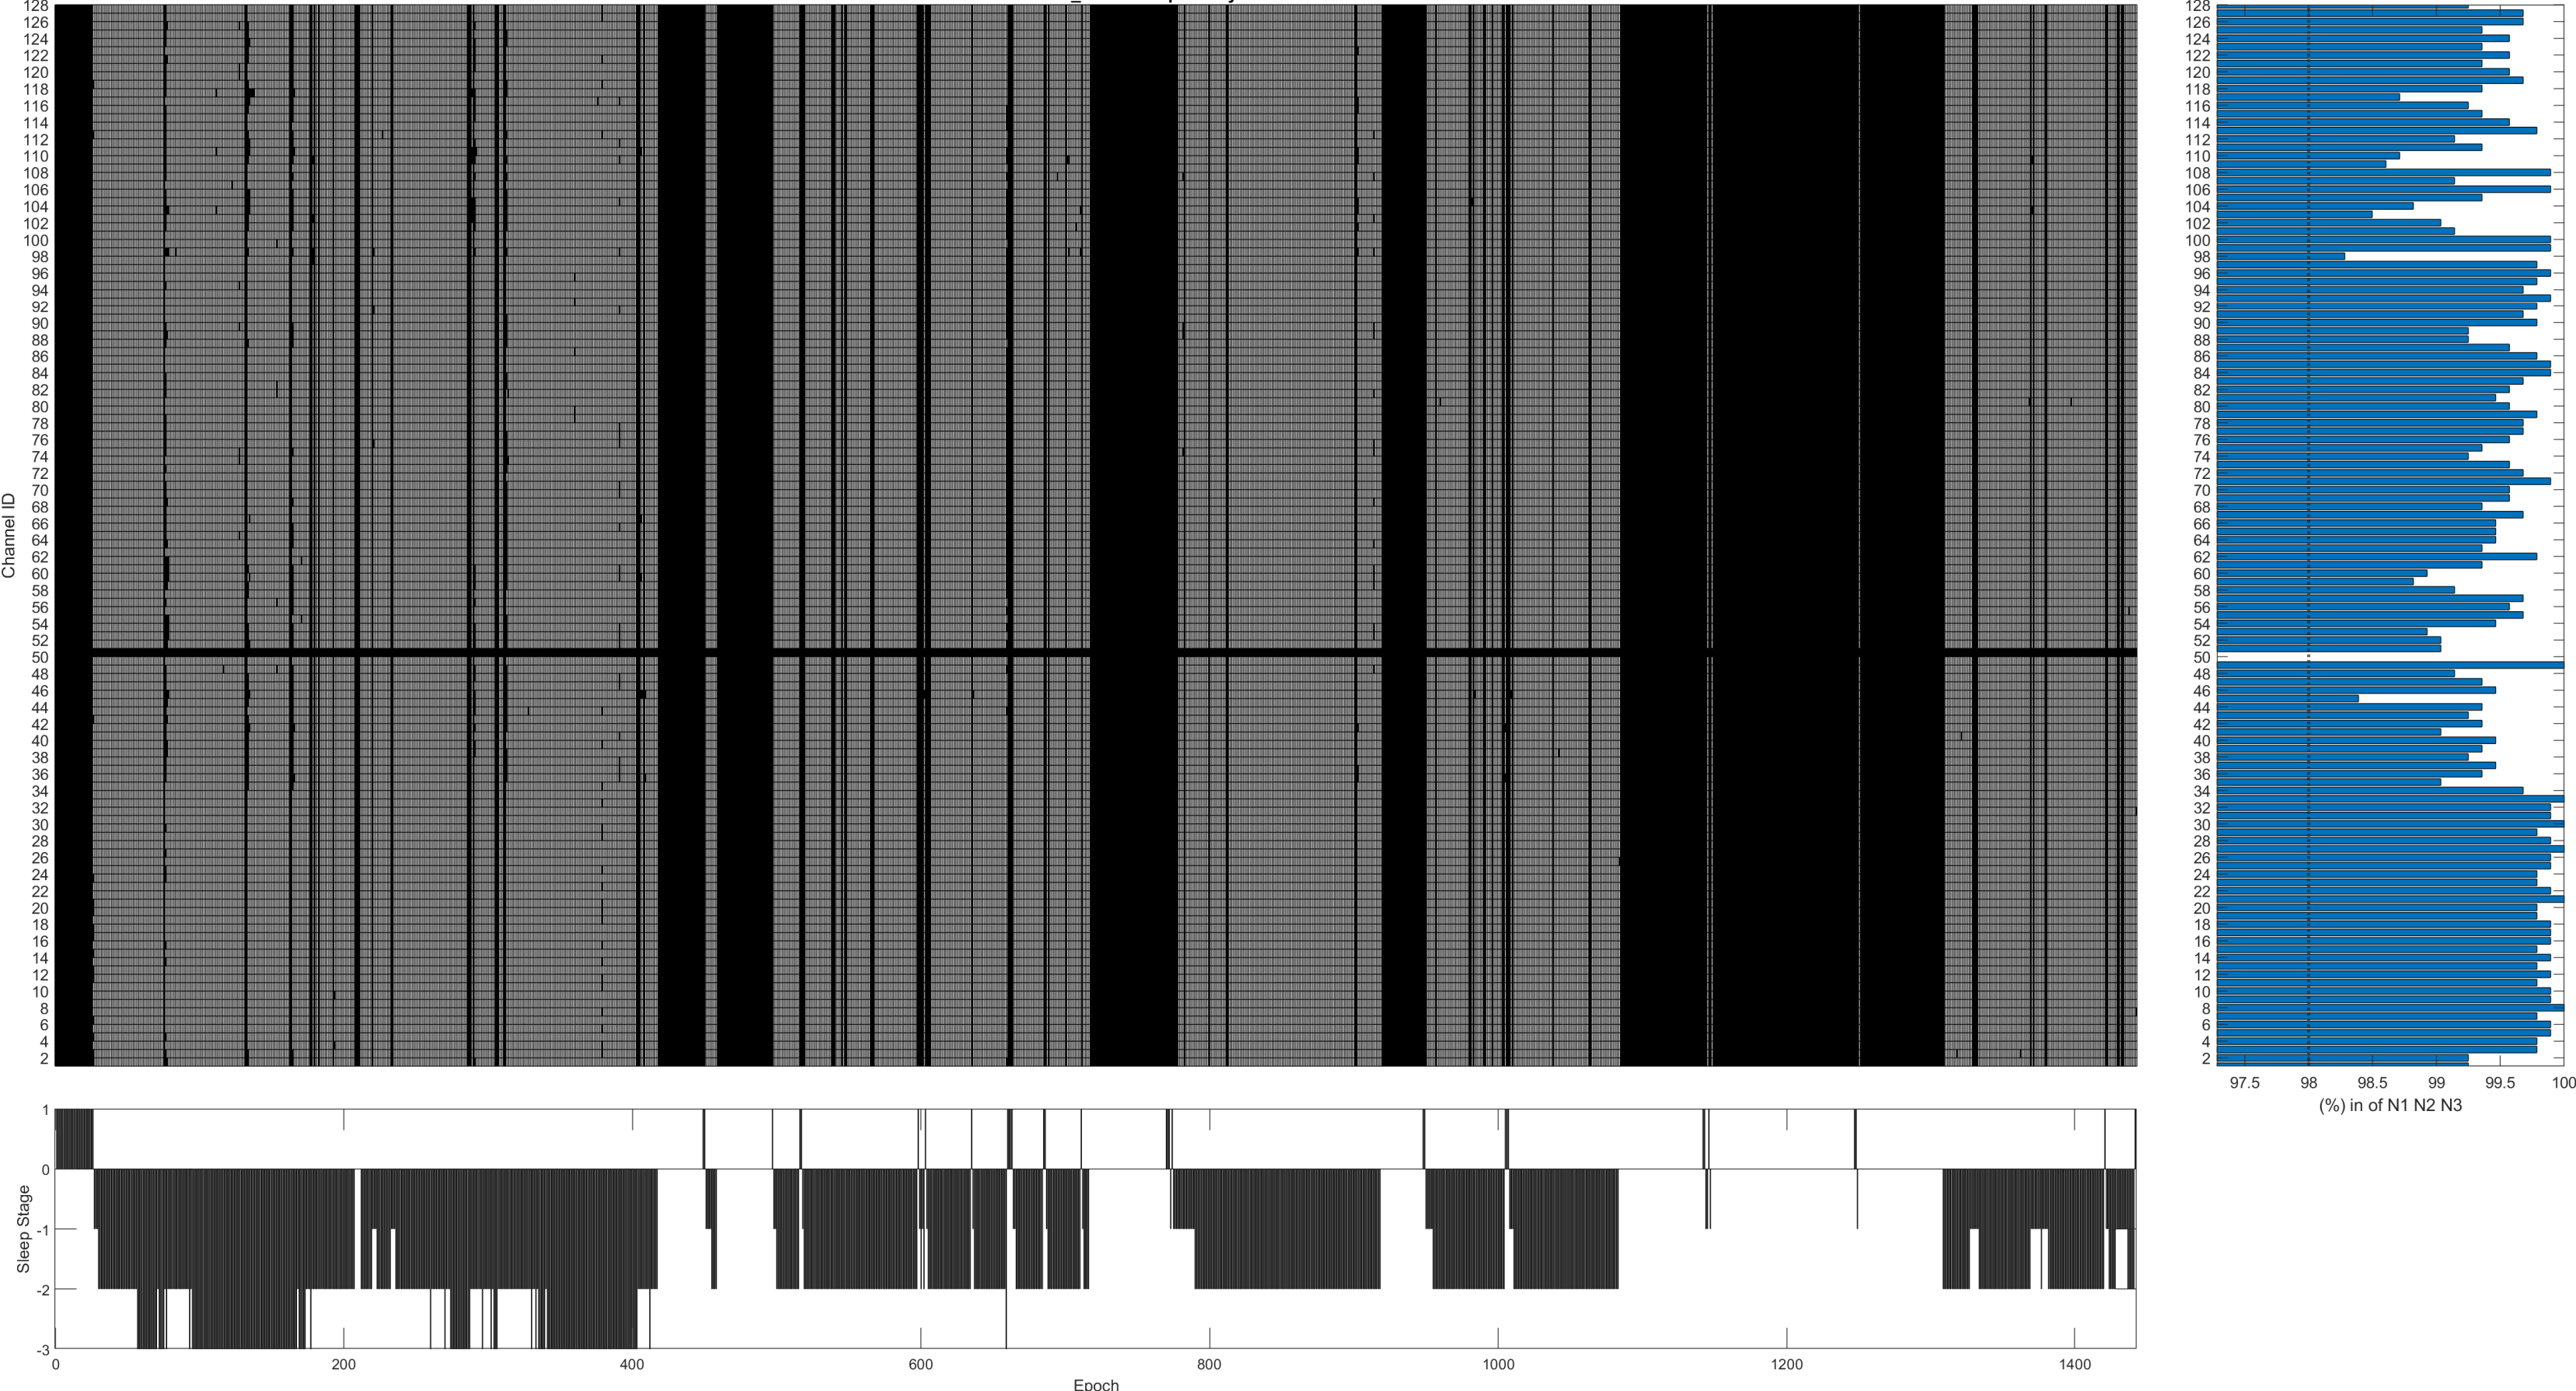
- When you have completed the artifactor rejection for all 128 channels, you can visualize your work. In this plot, all black columns represent either a noisy epoch or an epoch outside of N1, N2 and N3. Like this further analyses only consider clean epochs during NREM sleep. White columns represent those. Underneath you can see the corresponding sleep scoring, you can nicely see how bouts of REM sleep correspond to black bouts in all channels. In blue you can see the percentage of clean NREM epochs among all NREM epochs. We usually set a threshold (e.g. 97%) above which a channel needs to stay. Channels with e.g. less than 97% of clean NREM epochs are then considered as “bad” and will be interpolated in a next step.
Other approaches
Filter
Using a band pass filter with a frequency band of artefact, particular artefact can be removed. This method is not a very useful method for analysis of the entire bandwidth of EEG, as artifacts can occur at any frequency. A 50 Hz notch filter can used for removal of transmission line frequency. Low pass filter can used for Oculogram artefact removal.